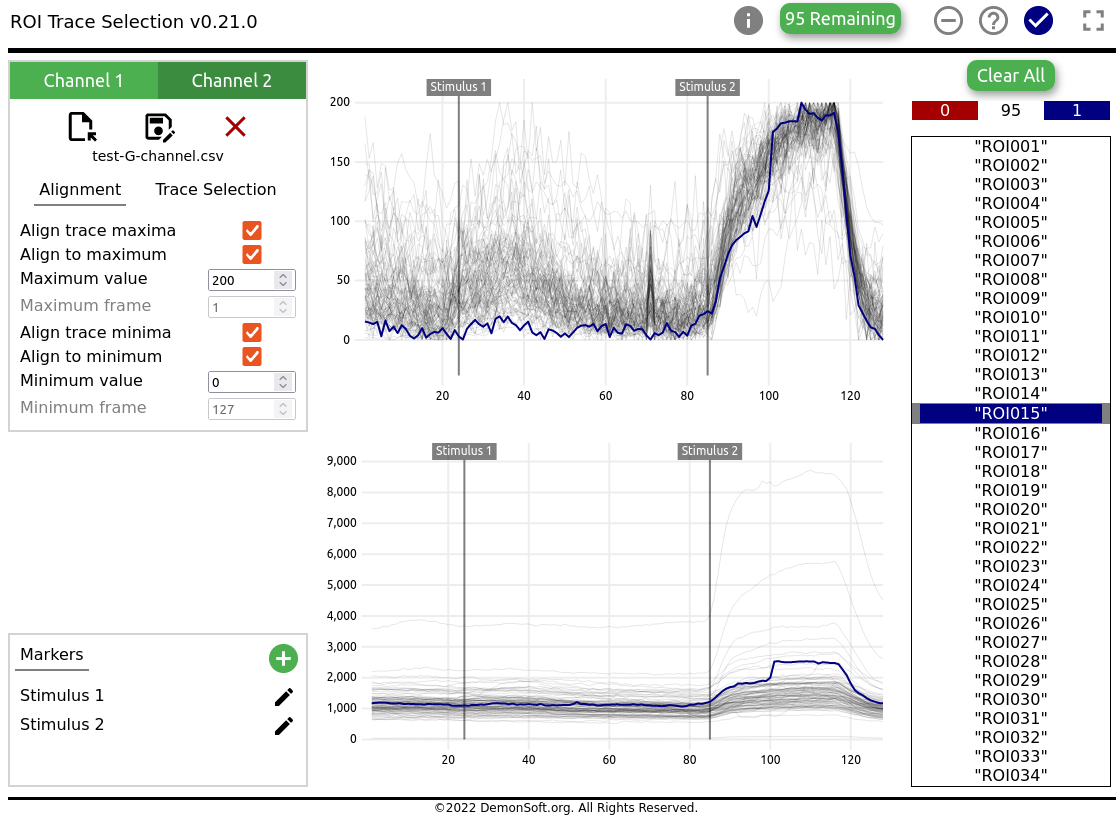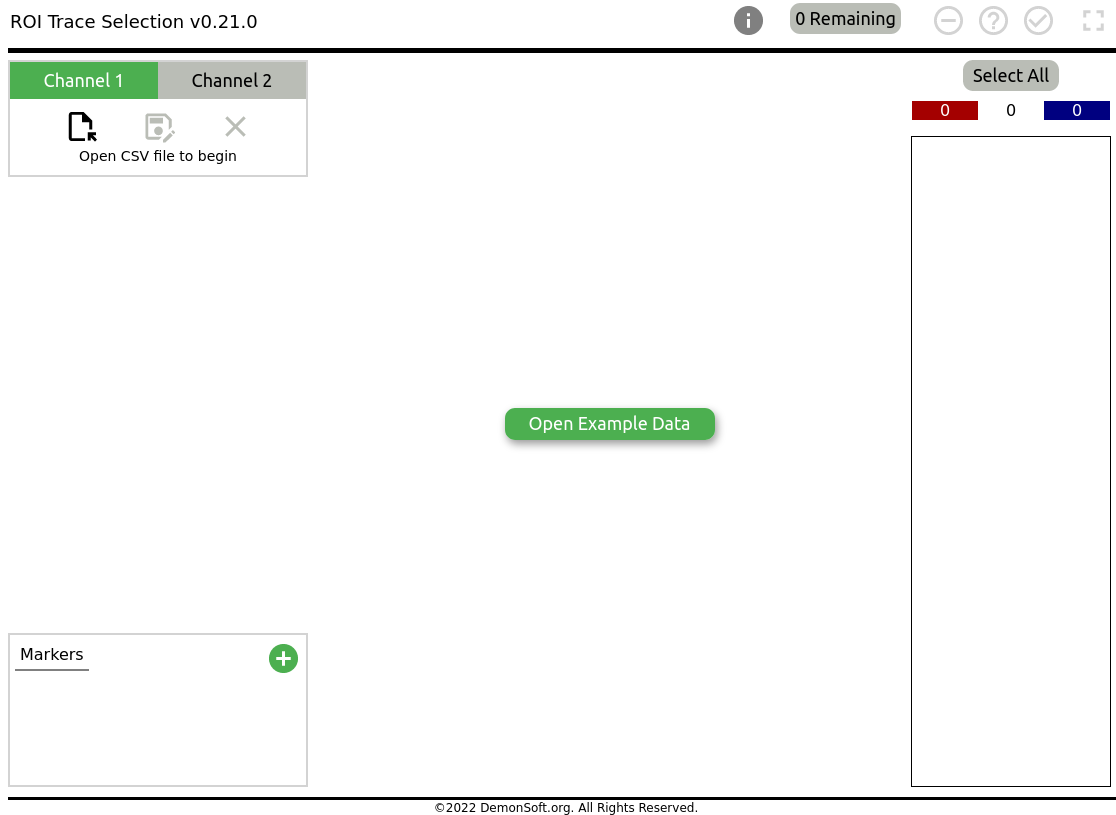
Figure 1: Initial application
Common imaging protocols using fluorescent dyes, such as that described in Cousin (2008) require the selection of numerical fluorescence traces during the data analysis stage. This web tool is designed to assist in selection of Regions of Interest (ROIs) which conform to expected behaviour. It should make the trace selection data preprocessing stage of ROI analysis slightly less painful. The tool provides a simple graph visualisation of a full set of time series traces. The user may then select or deselect individual traces, scale and offset the traces, and then output the results in CSV format. Additionally, as traces tend to follow an expected pattern for a given dataset, traces which do not follow this behaviour can be automatically excluded. These patterns are specified as percentage drops or increases in value within a given frame interval, the percentage being of the total value drop or increase. For example, select those traces which exhibit a 20% drop in value between frames 18 and 20, which corresponds with the time a large stimulus was applied during the assay.
Simply go to https://demonsoft.org/neuroscience/trace-selector. You should see the tool running as in Figure 1. The tool runs entirely in your browser, and no CSV data is transferred from your device.
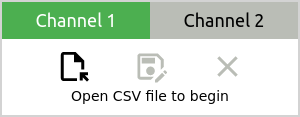
Clicking on the Open button will show a file select window. Pick your input data file in CSV format. Currently the tool expects the data to be in structure shown in Table Table 1.
The values are expected to be in order of individual traces in columns, and frames in rows. The first row contains the trace names, and the first column contains the frame indices (although these are always expected to be 1,2,3,4...). There are no other rows or columns apart from the trace values expected, although any mean or total value columns may be deselected later. If there are problems with parsing the data file, the tool will attempt to display as much of the data as possible, and give a warning. Users are recommended to fix problems with the input data file and reload before continuing. Once the file is selected, the tool will plot all traces in the chart.

To see the tool in action with some example data, click the Open Example Data button.
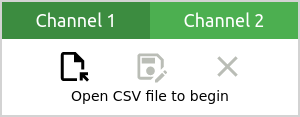
Some datasets have two channels, each with a CSV file. This tool allows traces from both channels to be viewed simultaneously, and trace selections will apply to both channels. To use two channel mode, open the first channel CSV file with Open, then click on the Channel 2 tab and open the second channel CSV file with Open. The CSV files must have matching trace names, trace counts and frame counts.
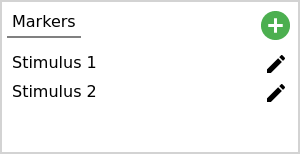
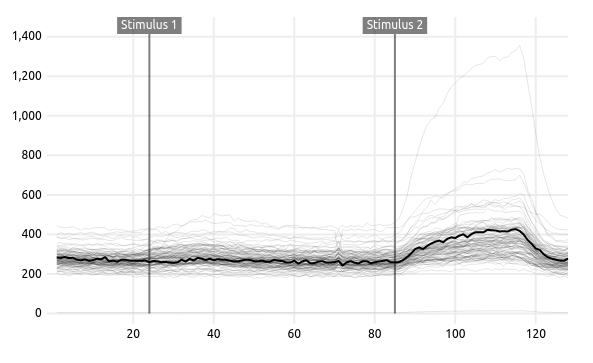
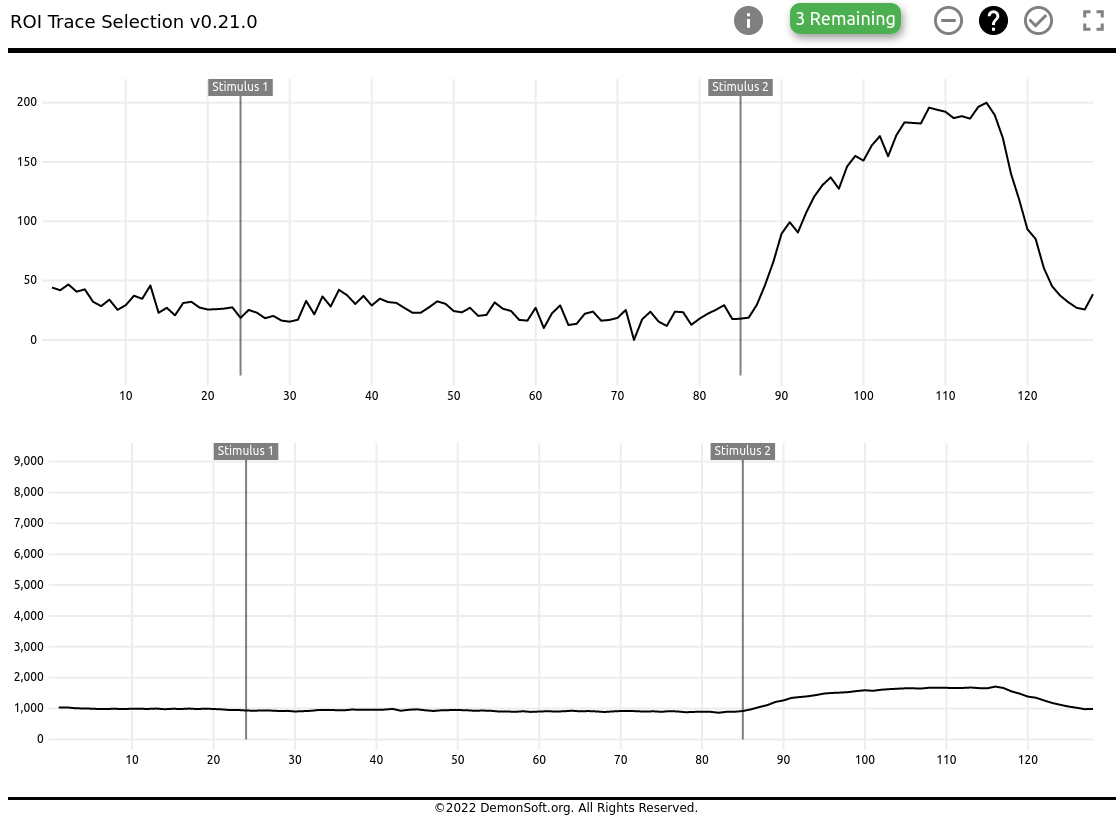
The user can add markers to guide interpretation of the results, for example drug addition at frame number x, stimulation at frame number y. The currently created frame markers are listed, and can be added to or removed (see Figure 2). Example frame markers are shown on the chart in Figure 3
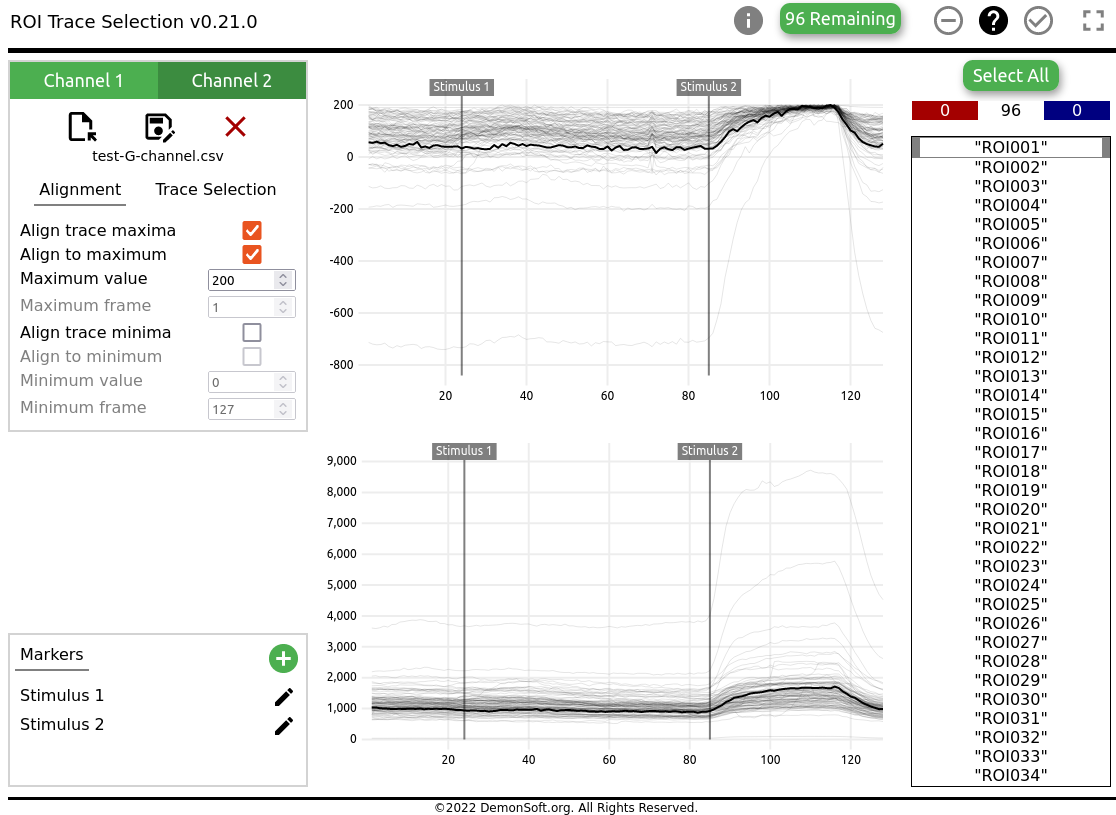
The Alignment section of the tool can offset the values to a common start value, and additionally scale all the traces to a common end value. Selecting Align trace maxima enables the offset to start value. The user can either pick a start frame to align to, or align all traces on each of their maximum values (see Figure 4).
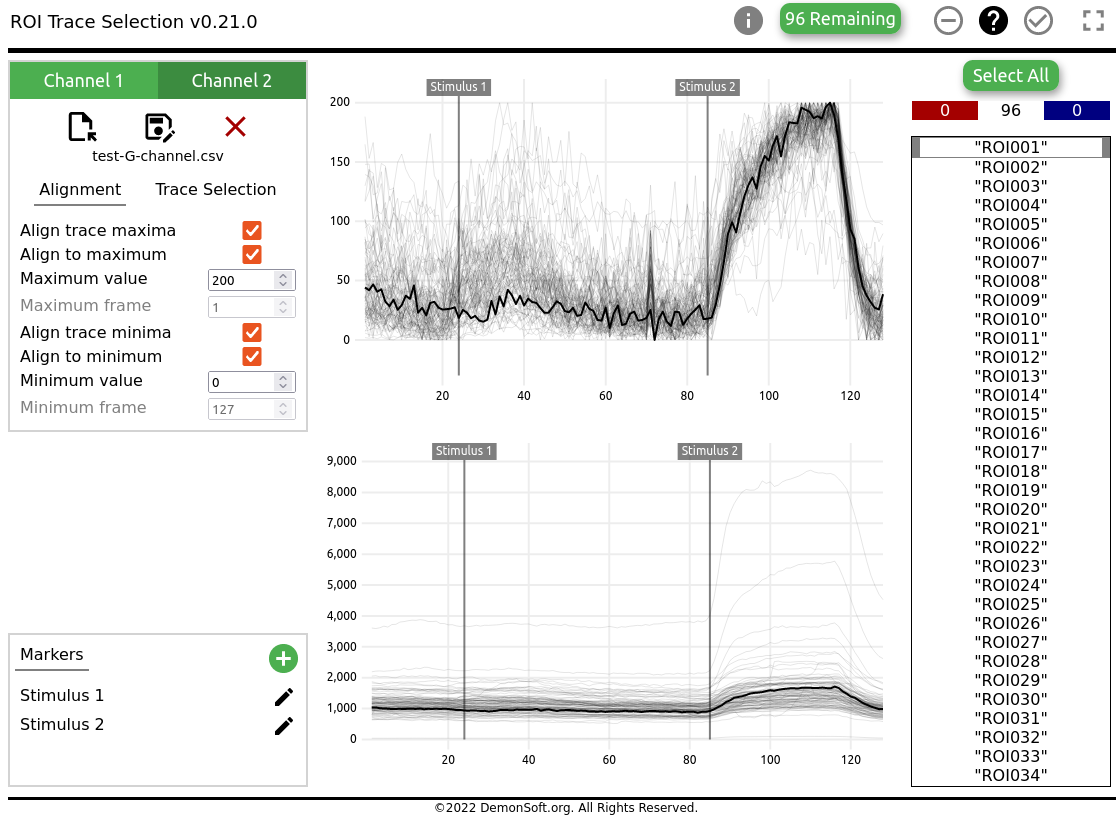
Selecting Align trace minima enables the scale to end value. Again, the user can either pick an end frame to align to, or align all traces on each of their minimum values (see Figure 5).
In both cases, the user may pick the value to align to.The main purpose of the tool is to allow easy removal of outlier traces. To do this, the user may either select traces manually, or filter them automatically with a threshold filter. To start, select the Trace Selection panel on the left. The user can manually select traces based on simple inspection. As in many cases, traces are manually identified by sharing common behaviour such as a sharp change in value at a particular frame interval (corresponding with a particular event occurring during data recording), the tool also allows for auto selection of traces on this basis. In dual channel mode, the user can choose which of the channels to use for automatic trace selection.
The traces selection list on the right of the charts shows which traces are currently selected or deselected (see Figure 6). Clicking on a particular trace will cycle through marking the trace as selected, deselected or undecided.
The trace selection list can also be navigated using the keyboard. The user can move up or down with the arrow keys and select or deselect the currently highlighted trace with the spacebar.
The traces on the charts will change colour depending on their selection status (see Table 2).
| Trace colour | Description |
|---|---|
| Red | Trace deselected |
| Black | Trace selection not decided |
| Blue | Trace selected |

Above the list the number of currently selected traces is shown, here for example 25 deselected, 68 selected and 3 undecided.

These icons show the selection state of the current trace; unselected, undecided, or selected. Clicking on these icons will also change the selection.

The button at the top of the list allows the user to select, unselect or clear all selections.

This button shows the number of traces that have not yet been decided. Clicking on it will choose the next undecided trace in the list.
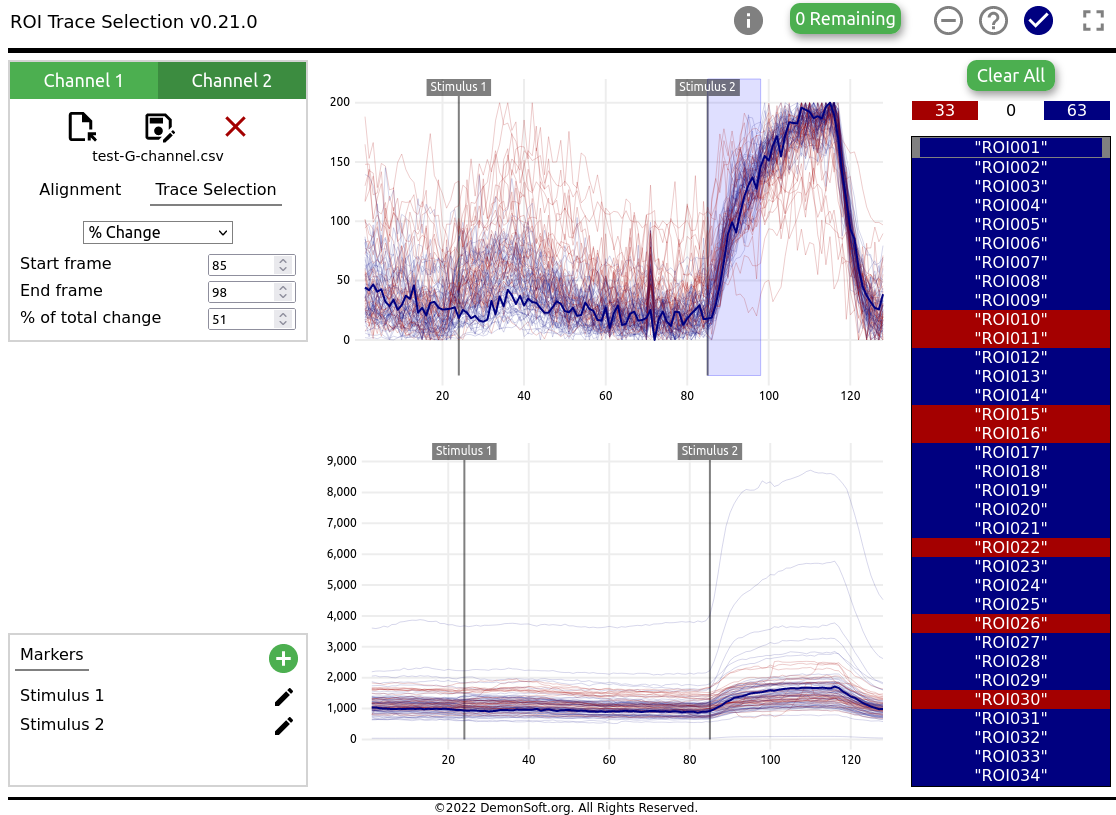
Selecting % Change will cause the chart to show a blue marker signifying the frame interval over which the value change will take place. Use the Start frame and End frame entries to adjust this frame interval. Then, one can set the % of total change to filter the traces. For example, if a trace had a total value range of 1000 units, and the % of total change was set to 20%, then the trace would need to have changed in value at least 200 units between the start and end of the chosen frame interval to be selected (see Figure 7).
After doing this auto selection, the final selection can still be adjusted by selecting or deselecting traces manually as described above.
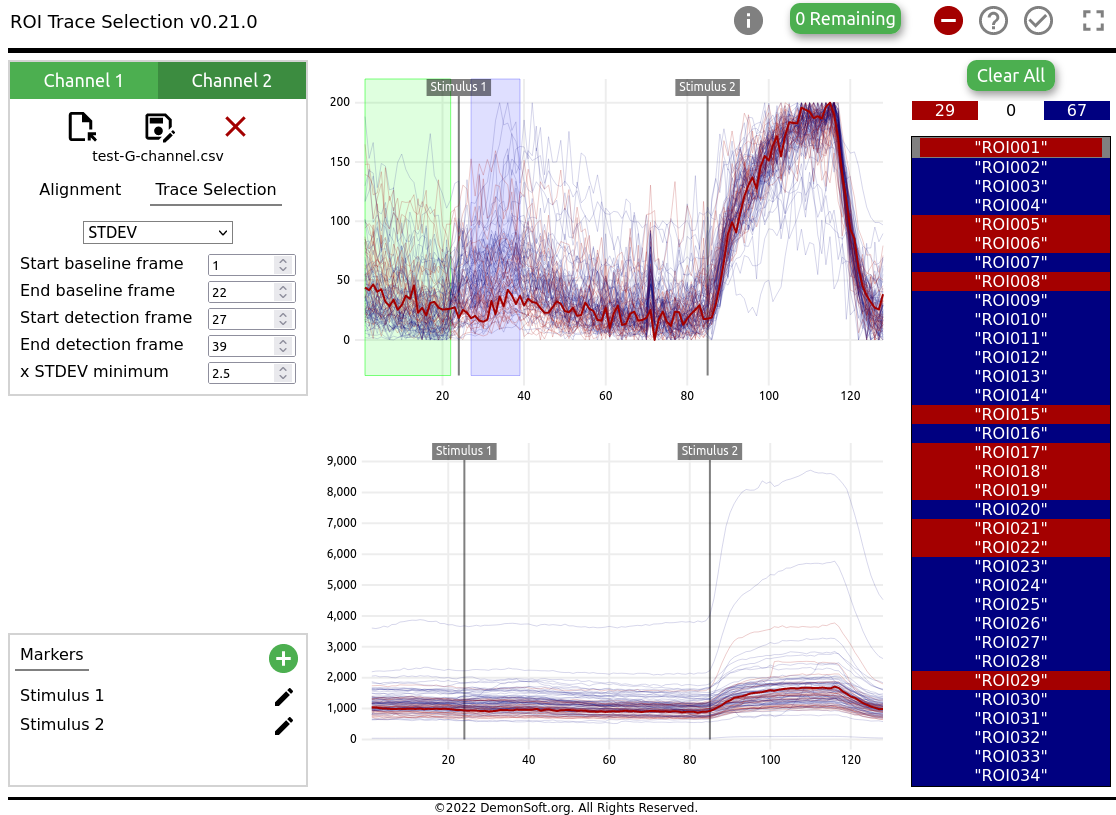
In some cases traces are only of interest if their trace values vary a given amount from their mean. The standard deviation threshold selection option allows this. Selecting STDEV allows the user to specify two frame regions in the chart (see Figure 8). The baseline region (highlighted in green on the chart) defines the region of each trace to use to calculate the mean and standard deviation. All trace measurements and selection are done individually, with each trace being independent of the rest. The detection region (highlighted in blue on the chart) defines the region to check for distance from the mean. Finally STDEV minimum multiple allows the user to define how much variance from the mean is required for trace selection.
For example, if the mean and standard deviation of a particular trace was 4.0 and 2.0 in the baseline region, and the STDEV minimum multiple was set to 1.5, then the selection threshold would be set at 2.0 x 1.5 = 3.0 from the mean. The trace will be selected only if at least one of its values in the detection region is either > 7.0 or < 1.0.
Again, after doing this auto selection, the final selection can still be adjusted manually.
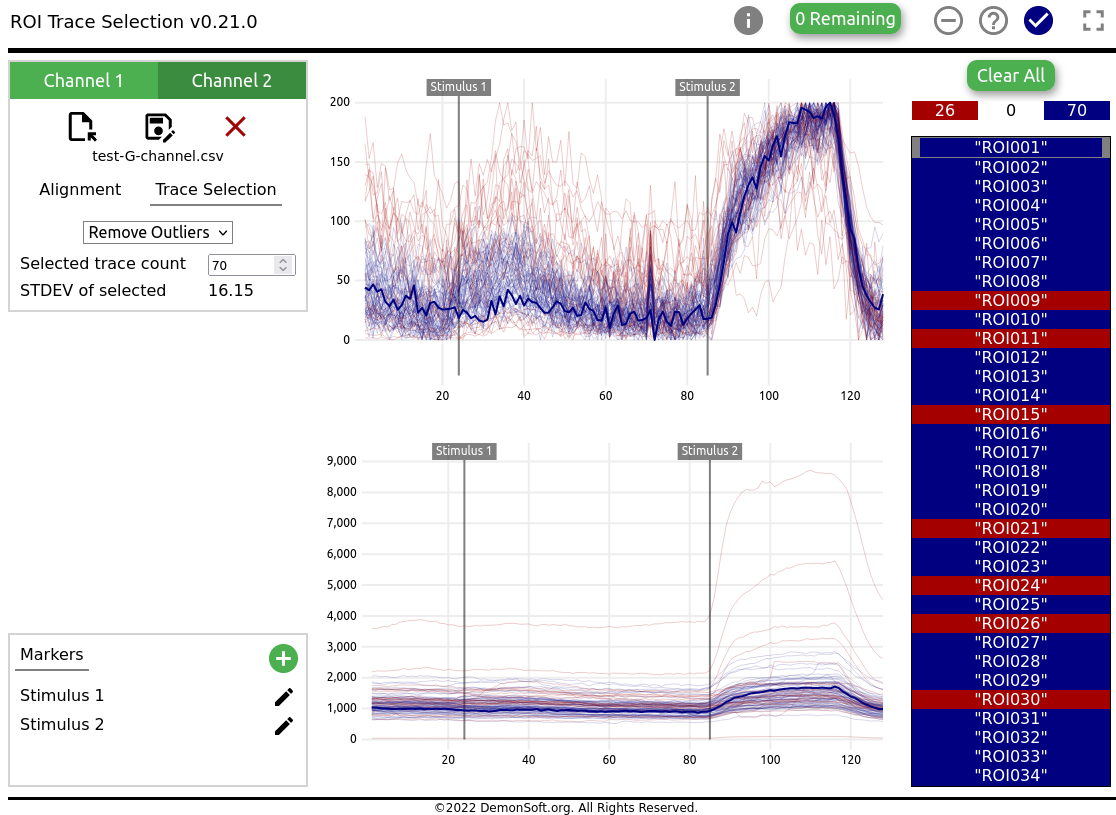
Selecting Remove Outliers allows the user to specify how many traces to select, and the tool will pick the subset of the available traces which produces the minimum standard deviation (see Figure 9).

To minimise user bias during manual selection, single trace selection mode displays only a single trace at a time. The user can select or deselect that trace without any visual comparison with the other traces in the dataset (see Figure 10). To choose this mode, click on the Fullscreen button. Clicking on the button again will return to normal mode.

Clicking on the Save as button save the currently selected traces in CSV format. The data will be saved using the displayed alignment and scaling values. Note that it is possible to perform the trace selection, then uncheck the alignment and scaling options, to allow saving of the original data values of only the selected traces. In dual channel mode, the channels may be saved separately.
Currently there is no issue tracker for the tool, so please email me at neuro@demonsoft.org if you have any comments or issues.
The original Java version of this tool was supported in part by grants EP/F500385/1 and BB/F529254/1 for the University of Edinburgh School of Informatics Doctoral Training Centre in Neuroinformatics and Computational Neuroscience (https://web.inf.ed.ac.uk/anc) from the UK Engineering and Physical Sciences Research Council (EPSRC), UK Biotechnology and Biological Sciences Research Council (BBSRC), and the UK Medical Research Council (MRC). Thanks to the members of the Cousin lab at the Centre for Integrative Biology at the University of Edinburgh for their many excellent suggestions, and for beta testing the original tool.
The web version of the tool was rewritten some time later (several times).